Do you have many software parts to run at the same time: a database, your main app (API), and monitoring tools? That can often be a headache!

The ‘It Works On My Machine’ Meme Is Dead. Docker Killed It (Thank God).
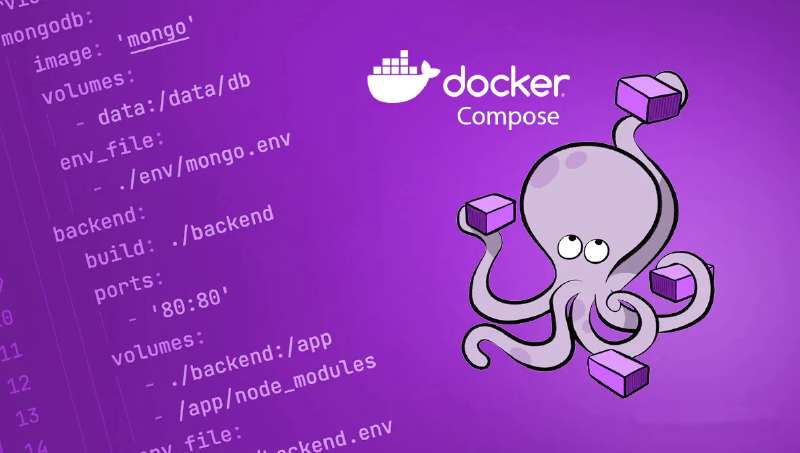
Docker Compose is the simplest solution. It’s like a “master switch” that lets you turn on or off your whole system (database, API, monitoring tools, and more) with just a couple of commands.
This guide shows you how to build a complete system with:
- Backend API: built with Go/Gin
- PostgreSQL: the database
- Prometheus: Gathers data/Monitoring
- Grafana: visualization
- cAdvisor: monitors the server’s health
Prerequisites
Before you begin, make sure you have the following installed:
- Docker Install Docker
- Docker Compose – Install Docker Compose
- Git (optional, for version control)
The main pieces (services)
Everything is defined in the docker-compose.yml file. Here’s what we have:
| Service Name | Role | Ports (Host:Container) |
|---|---|---|
| backend | Your main API application | 8000:8000 |
| db | Where data is stored (database) | 5433:5432 |
| prometheus | The tool that collects and stores metrics | 9090:9090 |
| grafana | The tool that shows your metrics as pretty charts | 3000:3000 |
| cadvisor | Monitors server/Docker resources | (No direct port needed) |
How the pieces talk to each other
The important part is how the services communicate:
- API (
backend) talks to the DB (db):- The API needs to know the database’s name. Instead of using
localhost, it uses the Docker service name, which is justdb(super simple!). - The password and database name (
DB_PASSWORD,DB_NAME) are set using environment variables.
- The API needs to know the database’s name. Instead of using
- Grafana talks to prometheus: Grafana needs data to draw charts, so it depends on
prometheus.
Keeping your data safe
You don’t want to lose data every time you turn off Docker, right?
- Database: We use a volume called
postgres_data. The data is saved outside the container, keeping it completely safe. - Grafana: Also uses a volume to save the dashboards you create.
Setting up the monitoring tools
We set up a three-step “monitoring” system:
Prometheus - collecting the data
Prometheus needs to know where to “scrape” (fetch) data from.
- We use the
prometheus/prometheus.ymlfile to tell it: “Go get data from thebackend:8000service every 15 seconds.”
cAdvisor - monitoring server health
- cAdvisor is a tool that tracks the “health” of Docker and your computer (CPU, RAM usage).
- It’s specially configured to be able to “see” the system information.
Grafana - viewing the charts
- You access it at
http://localhost:3000. - Log in with username:
adminand password:admin. - Here, you connect Grafana to Prometheus. Then, you use that data to build charts that track API performance, DB speed, or RAM/CPU usage.
Setup docker compose
We’ll use a docker-compose.yml file to define all the containers, networks, and volumes in our environment.
services: book-api: container_name: backend build: context: . dockerfile: Dockerfile ports: - "5000:5000" restart: 'on-failure' environment: POSTGRES_HOST: db POSTGRES_DB: DB_NAME POSTGRES_PORT: 5432 POSTGRES_USER: postgres POSTGRES_PASSWORD: DB_PASSWORD GATEWAY_HOST: BASE_URL depends_on: - db ccadvisor: image: gcr.io/cadvisor/cadvisor:latest container_name: book-api-cadvisor restart: always volumes: - /etc/localtime:/etc/localtime:ro - /etc/timezone:/etc/timezone:ro - /:/rootfs:ro - /var/run:/var/run:rw - /sys:/sys:ro - /var/lib/docker:/var/lib/docker:ro - /var/run/docker.sock:/var/run/docker.sock:rw devices: - /dev/kmsg:/dev/kmsg depends_on: - book-api prometheus: image: prom/prometheus:latest container_name: book-api-prometheus restart: always volumes: - /etc/localtime:/etc/localtime:ro - /etc/timezone:/etc/timezone:ro - ./prometheus:/etc/prometheus command: - '--config.file=/etc/prometheus/prometheus.yml' ports: - '9090:9090' grafana: image: grafana/grafana:latest container_name: book-api-grafana restart: always volumes: - /etc/localtime:/etc/localtime:ro - /etc/timezone:/etc/timezone:ro - ./grafana/grafana.ini:/etc/grafana/grafana.ini - ./grafana/provisioning:/etc/grafana/provisioning - ./grafana/data:/var/lib/grafana user: "1000" depends_on: - prometheus ports: - "3000:3000" db: image: postgres:15 container_name: postgres_container restart: always environment: POSTGRES_DB: DB_NAME POSTGRES_USER: postgres POSTGRES_PASSWORD: DB_PASSWORD ports: - "5433:5432" volumes: - postgres_data:/var/lib/postgresql/data
volumes: postgres_data:Run and manage
This is the easiest part, with only 2 main commands!
Start the whole system
Run this command. Docker will automatically download what’s needed, build your API, and run all the services at once:
docker-compose up -dNote
-d means run in the background
Tip
This will build the backend image, pull other service images, and start all containers in detached mode.
Access the services
Once everything is running, you can visit the services:
| Service | Address |
|---|---|
| Backend | http://localhost:8000 |
| Prometheus | http://localhost:9090 |
| Grafana | http://localhost:3000 |
Stop and clean up
When you want to turn off the whole system (e.g., at the end of the workday), use this command:
docker-compose downTip
This command stops the services but keeps your data safe (thanks to the volume), so you don’t lose anything!
Customizing configuration files
Prometheus configuration
You can add more scrape targets to monitor additional services.
- job_name: 'cadvisor' static_configs: - targets: ['cadvisor:8080']Grafana dashboards
Add your custom dashboards in grafana/provisioning/dashboards/. Grafana automatically loads these on startup.
Conclusion
With docker compose, you can run your entire stack — API, database, and monitoring tools — using a single command. It simplifies setup, saves time, and keeps your environment consistent across development and production.